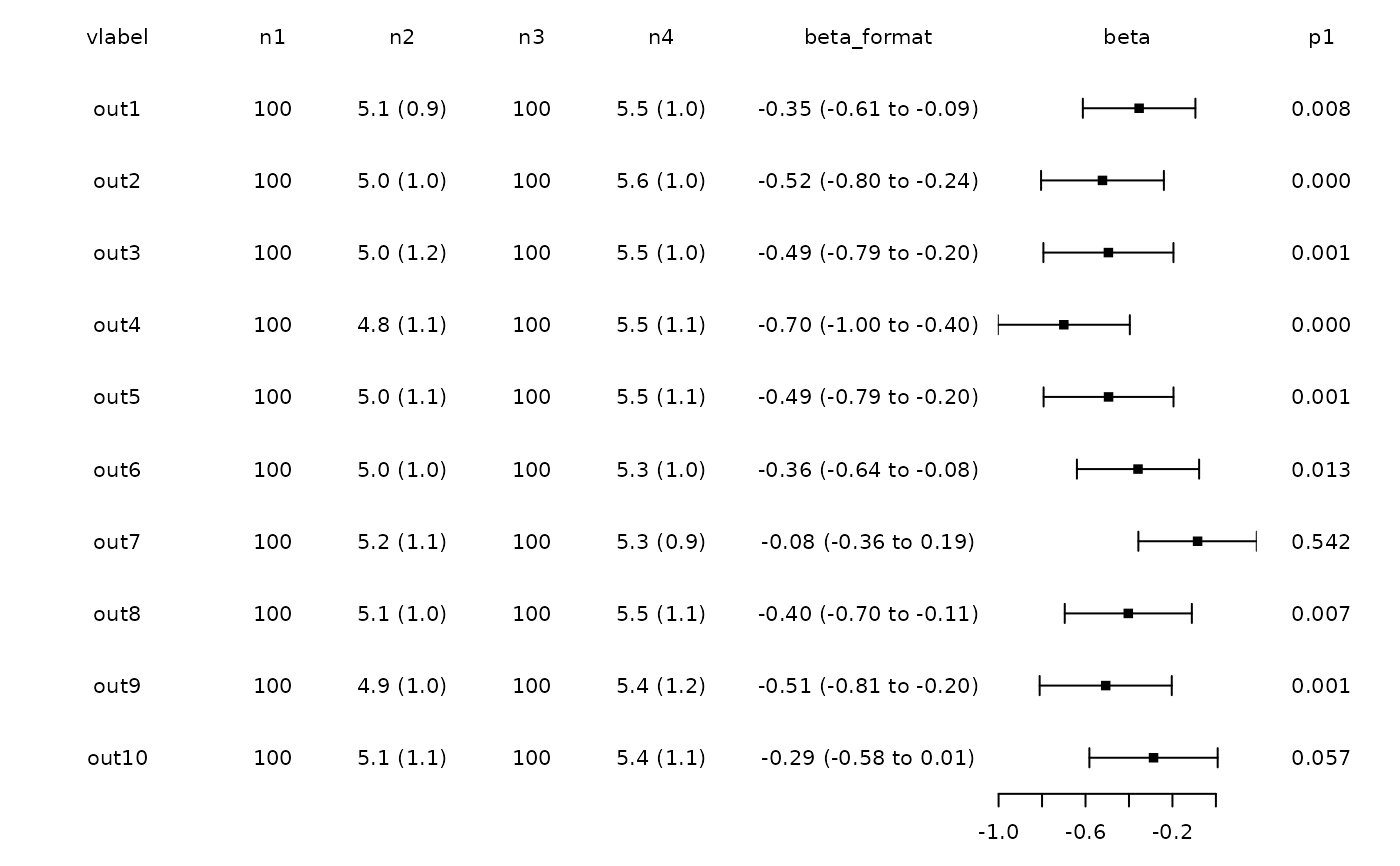
First step to generate a forest plot. Generates a fobj that can be plotted.
Arguments
- layout
layout of the plot, character vector with 't' (text), 'f' (forest), 's' (strip), 'b' (boxplot) or 'd' (density plot).
- dat
data frame that should be plotted
- obs
Optional data frame with the observations for the boxplot. Required of layout includes 'b' or 'd'.
- lwidths
Optional numeric vector with the relative widths of the columns. Must have the same length as layout.
- lheights
Optional numeric vector of length 3 with the relative heights of header, main panel and footer.
- y.at
Optional numeric vector with the position of the rows. Usually not required.
- ylim
Optional limits of the rows. Usually not required.