Plot absolute stopping probabilities
Examples
harmbound<-getHarmBound(nevents=seq(10,100,by=10),alpha_test=0.025,pH0=0.5,pH1=c(0.6,0.7,0.8))
absstopPlot(harmbound)
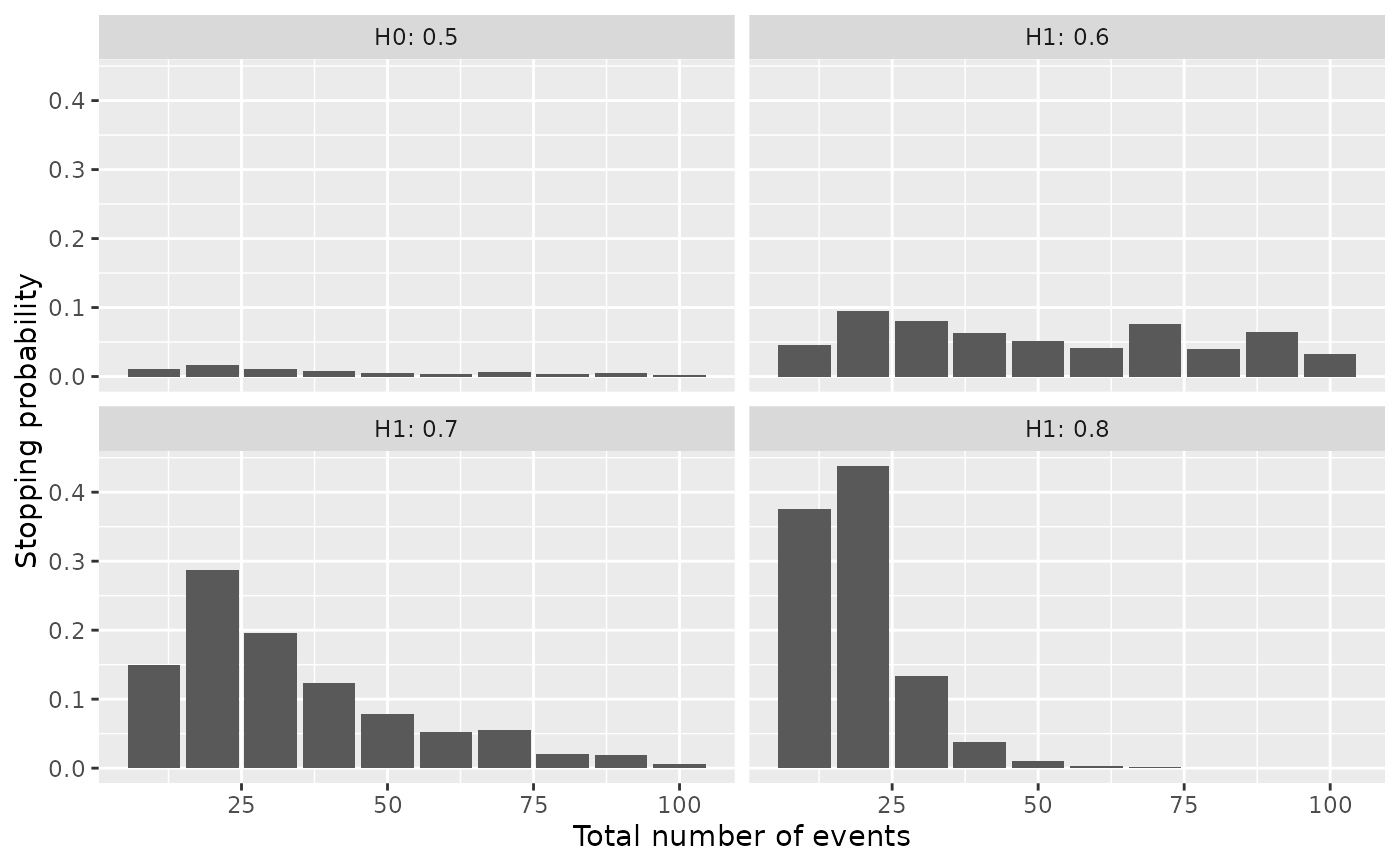
Plot absolute stopping probabilities
harmbound<-getHarmBound(nevents=seq(10,100,by=10),alpha_test=0.025,pH0=0.5,pH1=c(0.6,0.7,0.8))
absstopPlot(harmbound)