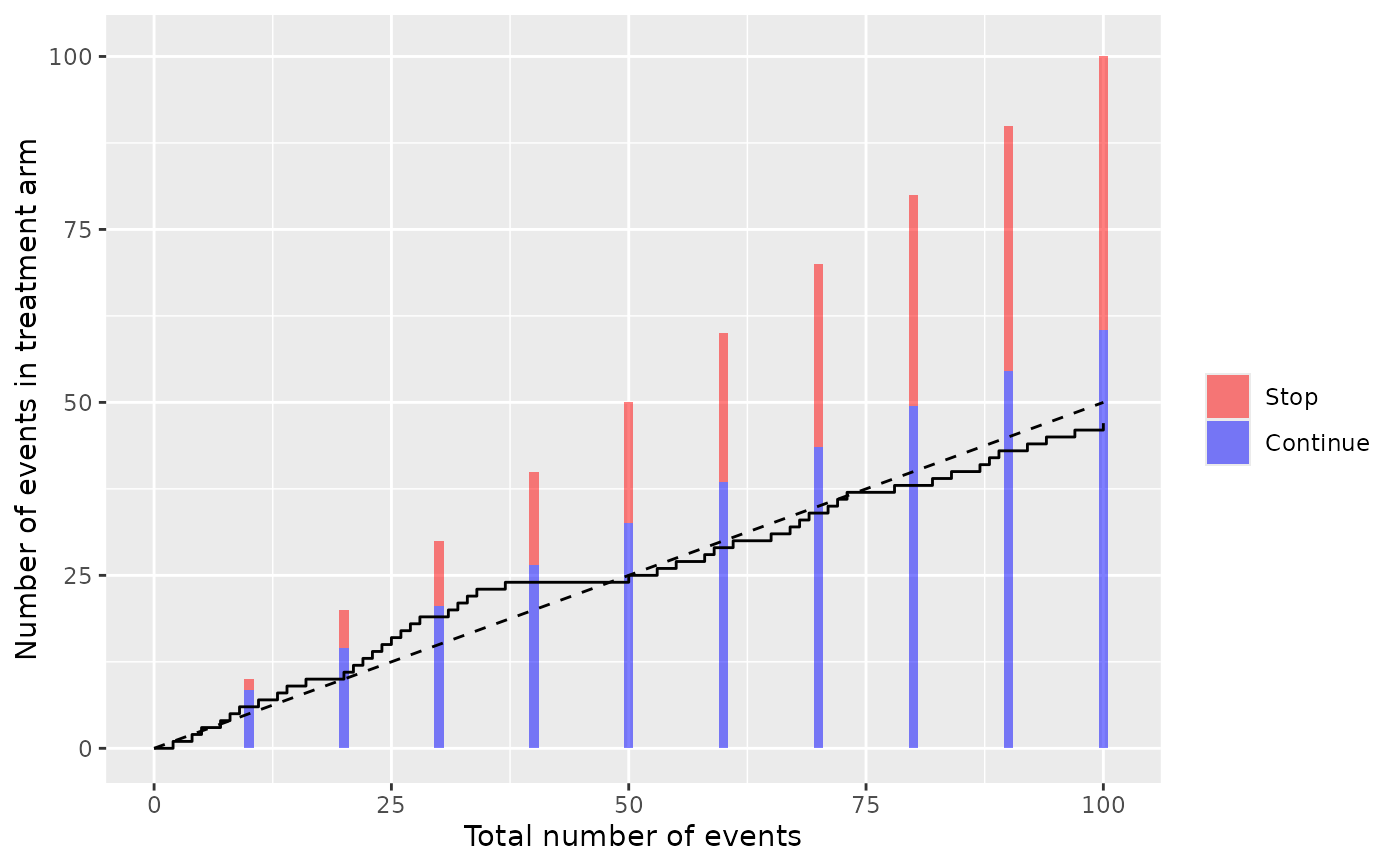
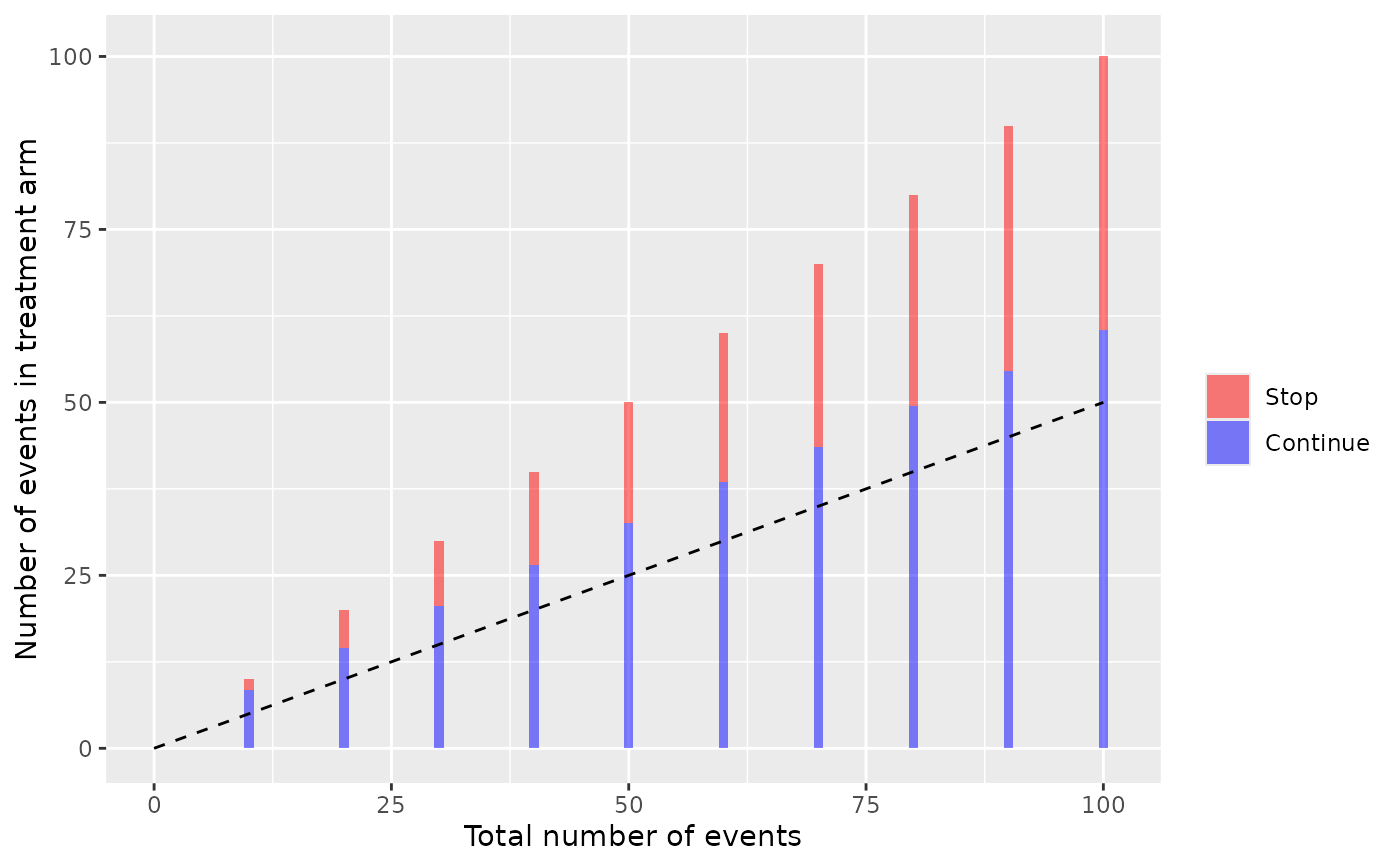
Plot harmbounds and the observed events
Usage
harmboundPlot(
  harmbound,
  observed = NULL,
  colourbound = c("blue", "red"),
  fill_alpha = 0.5,
  colourobserved = "black",
  H0line = TRUE
)
Arguments
- harmbound
harmbounds objects as generated using the getHarmBound function
- observed
optional observed number of events, as a vector with the sequential arms in which an event occured (0 for control and 1 for treatment)
- colourbound
vector with two colours for the bounds, in and out, default is blue and red
- fill_alpha
opacity of the colours for the bounds
- colourobserved
colour for the line with the observed events
- H0line
logical, whether a line to indicate the expectations should be added.
Examples
harmbound<-getHarmBound(nevents=seq(10,100,by=10),alpha_test=0.025,pH0=0.5)
harmboundPlot(harmbound)
 set.seed(123)
eventgroups<-rbinom(n=100,size=1,prob=0.5)
harmboundPlot(harmbound,observed=eventgroups)
set.seed(123)
eventgroups<-rbinom(n=100,size=1,prob=0.5)
harmboundPlot(harmbound,observed=eventgroups)