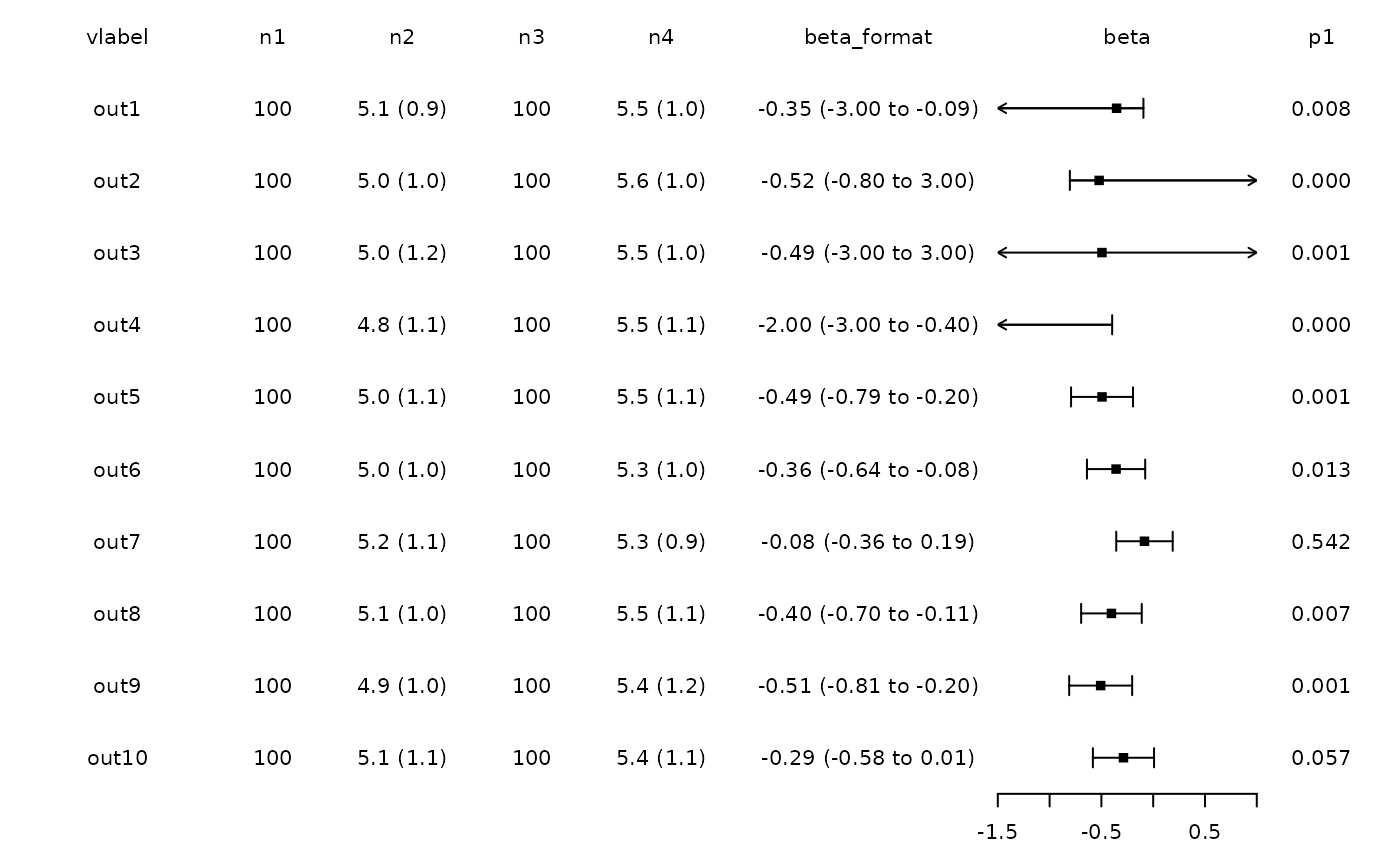
Adds arrowheads to confidence intervals which extend beyond the x-axis limits in forest (f) items of a forest plot object (fobj)
Source:R/genfobj.R
f_cutarrows.RdAdds arrowheads to confidence intervals which extend beyond the x-axis limits in forest (f) items of a forest plot object (fobj)
Examples
#Modify data
dat<-forplotdata
dat$beta_lci[1]<-c(-3)
dat$beta_uci[2]<-c(3)
dat[3,c("beta_lci","beta_uci")]<-c(-3,3)
dat[4,c("beta","beta_lci")]<-c(-2,-3)
dat$beta_format<-paste0(sprintf("%2.2f",dat$beta),
" (",sprintf("%2.2f",dat$beta_lci)," to ",
sprintf("%2.2f",dat$beta_uci),")")

#Generat fobj
fobj<-genfobj(layout = c("t","t","t","t","t","t","f","t"),
dat = dat, lwidths = c(0.8,0.4,0.6,0.4,0.6,1,1,0.5))

#Cut arrows
fobj<-f_axis(fobj, xlim=c(-1.5,1))
fobj<-f_cutarrows(fobj)
plotfobj(fobj)