Arguments
- fobj
a forest plot object of class 'fobj'
- ...
options to be passed to rect
Value
a forest plot object of class 'fobj'
Examples
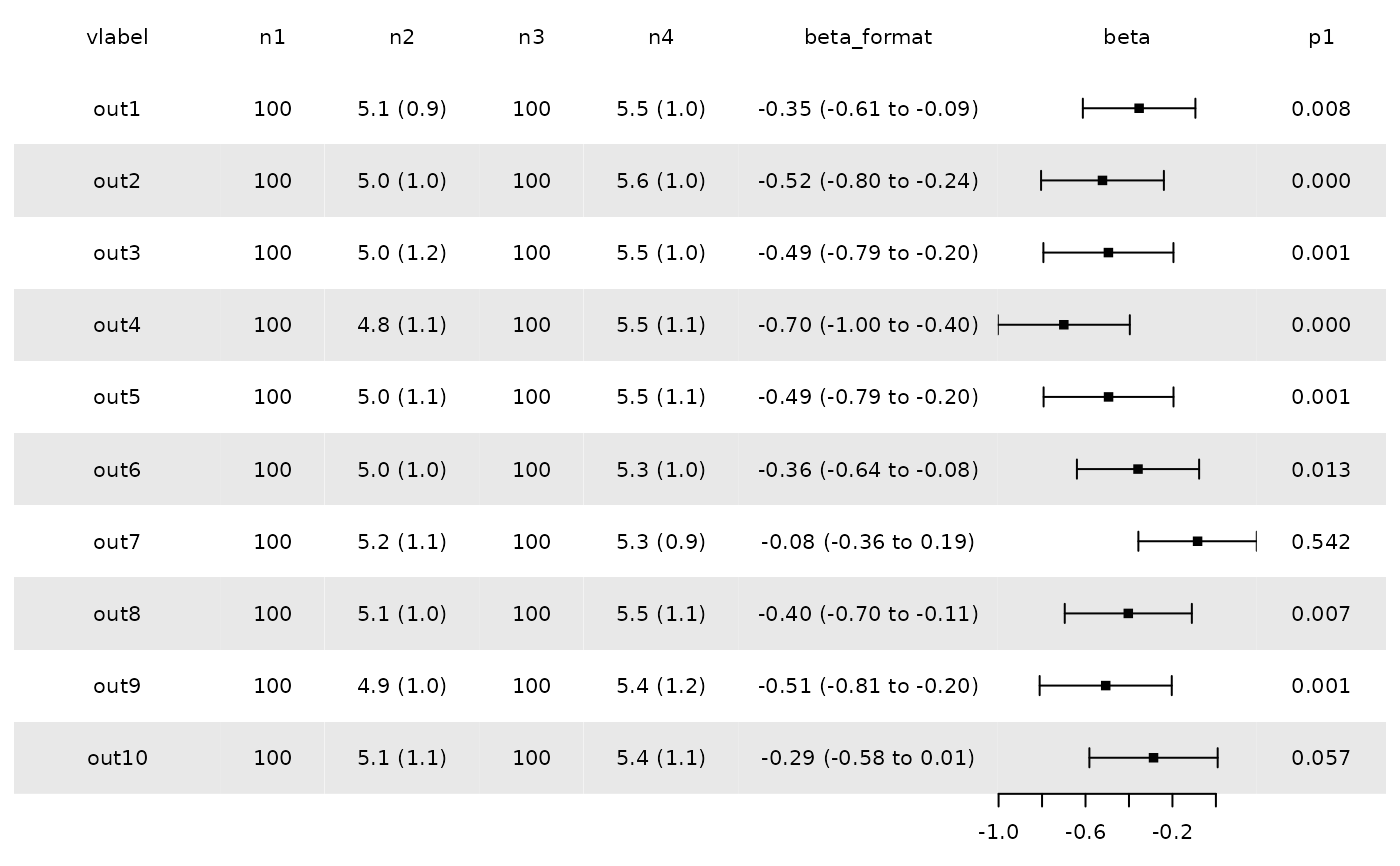
fobj<-genfobj(layout = c("t","t","t","t","t","t","f","t"),
  dat = forplotdata,
lwidths = c(0.8,0.4,0.6,0.4,0.6,1,1,0.5))
fobj<-stripes(fobj = fobj)
plotfobj(fobj)